Description
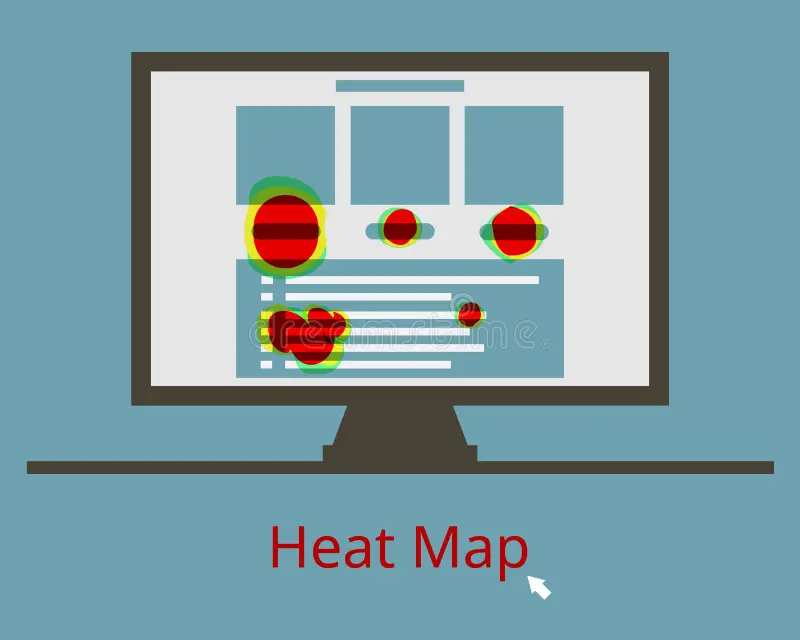
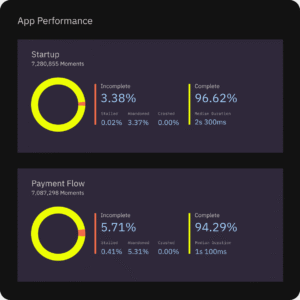
Our Website Heatmap & User Behavior Analysis service provides visual intelligence into how users interact with your digital interfaces. We deploy tools like Hotjar, Microsoft Clarity, Crazy Egg, or FullStory to generate heatmaps, scrollmaps, and session replays that highlight how visitors engage with CTAs, navigation, forms, and content. You’ll uncover high-dropoff zones, rage-click patterns, mouse movement paths, and element visibility rates—turning passive metrics into actionable design improvements. Combined with conversion funnel tracking and device/browser segmentation, this service helps refine user journeys and eliminate UX friction. We also offer A/B test recommendations, personalization strategies, and UI performance benchmarking based on user cohort behavior. All findings are anonymized and GDPR/CCPA compliant. Whether you’re optimizing ecommerce flows, landing pages, or SaaS onboarding, this service provides a powerful UX lens that bridges the gap between design intention and user experience—ultimately driving higher engagement, conversions, and retention.


Tobi –
The website heatmap and user behavior analysis provided invaluable insights into how our customers interact with our site. We were able to identify areas of friction and optimize the user experience based on concrete data, leading to a noticeable improvement in conversion rates. This service has empowered us to make informed decisions and continuously improve our online presence.
Bunmi –
The website heatmap and user behavior analysis provided invaluable insights into how visitors interacted with our site. We were able to pinpoint areas of friction and understand user flow patterns we hadn’t noticed before. This data empowered us to make targeted improvements to our UX, leading to a measurable increase in conversion rates. It’s a powerful tool for optimizing any website and ensuring a positive user experience.
Hadiza –
The website heatmap and user behavior analysis service has been incredibly valuable in understanding how visitors interact with our site. The visual data provided on clicks, scrolls, and user flow gave us actionable insights into areas for improvement, leading to a noticeable increase in conversion rates. The data-driven approach has allowed us to make informed decisions about our UX, ultimately enhancing the overall user experience and achieving better results.